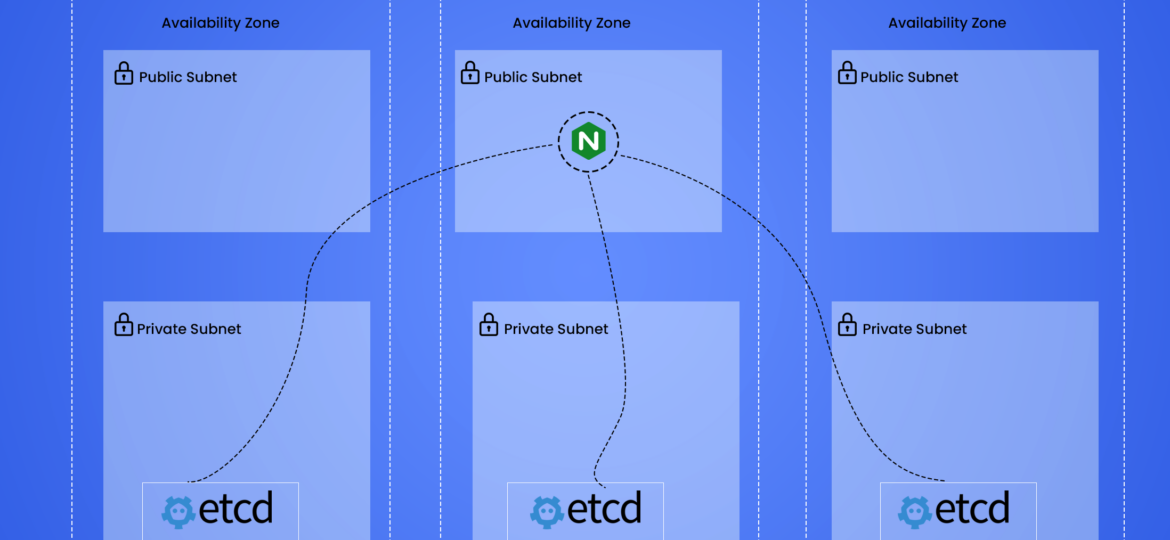
ETCD on Kubernetes with High Availability
In this blog, we will cover how to monitor Etcd on Kubernetes with High Availability. We will be installing Etcd v3.5.4 on Amazon Elastic Kubernetes Service (EKS), but a similar setup should work for other Kubernetes clusters as well.
Prerequisites
- Kubernetes 1.19+
- Helm 3.2.0+
- Clone and create a feature branch in `etcd` repository. Update the etcd cluster using helm to v3.5.4 from here – https://github.com/bitnami/charts/tree/master/bitnami/etcd
ETCD Monitoring using ServiceMonitor
Each etcd server exports metrics under the /metrics path on its client port. To scrape the Etcd cluster using Prometheus and Grafana, setup a ServiceMonitor in your Kubernetes cluster as shown below:
apiVersion: monitoring.coreos.com/v1
kind: ServiceMonitor
metadata:
  name: etcd-service-monitor
  labels:
    release: kube-prometheus-stack
  namespace: etcd
spec:
  selector:
    matchLabels:
      app.kubernetes.io/instance: etcd
      app.kubernetes.io/name: etcd
  namespaceSelector:
    matchNames:
    - etcd
  endpoints:
  - targetPort: 2379
    path: /metrics
Note: Deprecate etcd_debugging_mvcc_db_total_size_in_bytes Prometheus metrics
etcd_debugging_mvcc_db_total_size_in_bytes is deprecated in v3.4 Prometheus metrics.
To monitor etcd v3.5 db size you have to change the metrics to etcd_mvcc_db_total_size_in_bytes in prometheus or grafana.
– etcd_debugging_mvcc_db_total_size_in_bytes
+ etcd_mvcc_db_total_size_in_bytes
Prometheus
If you do not have Prometheus installed already, you can install it with the following command:
PROMETHEUS_VERSION="1.3.1"
wget https://github.com/prometheus/prometheus/releases/download/v$PROMETHEUS_VERSION/prometheus-$PROMETHEUS_VERSION.linux-amd64.tar.gz -O /tmp/prometheus-$PROMETHEUS_VERSION.linux-amd64.tar.gz
tar -xvzf /tmp/prometheus-$PROMETHEUS_VERSION.linux-amd64.tar.gz --directory /tmp/ --strip-components=1
/tmp/prometheus -version
Then, set Prometheus’s scraper to target the etcd cluster endpoints
cat > /tmp/test-etcd.yaml <<EOF
global:
  scrape_interval: 10s
scrape_configs:
  - job_name: test-etcd
    static_configs:
    - targets: ['10.240.0.32:2379','10.240.0.33:2379','10.240.0.34:2379']
EOF
cat /tmp/test-etcd.yam
Finally, set up the Prometheus handler i.e.
nohup /tmp/prometheus \
    -config.file /tmp/test-etcd.yaml \
    -web.listen-address ":9090" \
    -storage.local.path "test-etcd.data" >> /tmp/test-etcd.log  2>&1 &
Now Prometheus will scrape etcd metrics every 10 seconds.
Grafana
Grafana has built-in Prometheus support; just add a Prometheus data source:
Name:   test-etcd
Type:   Prometheus
Url:    http://localhost:9090
Access: proxy
Then import the default etcd dashboard template and customize. For instance, if Prometheus data source name is my-etcd, the datasource field values in JSON also need to be my-etcd. See the demo.
Detailed steps on Prometheus and Grafana installation and configuration can be found here
You can checkout more of our blogs here


